Prologue · 1822 – 1920
Power on the waterfront
Boston's first energy plants stood on land made from the harbor, where coal arrived by ship.
The lens shows the 1867 fire-insurance atlas over today's aerial photo. Move it with your cursor. Drag the map to explore; use the slider to change the atlas year.
This is the North End gas works, the city's first energy plant. Its gasholder stood here from 1828 until the works moved to Commercial Point.
Sites and method from Genna Kane, "Making Power, Making Land" (Leventhal Map & Education Center, 2025).
Prologue · L Street, South Boston
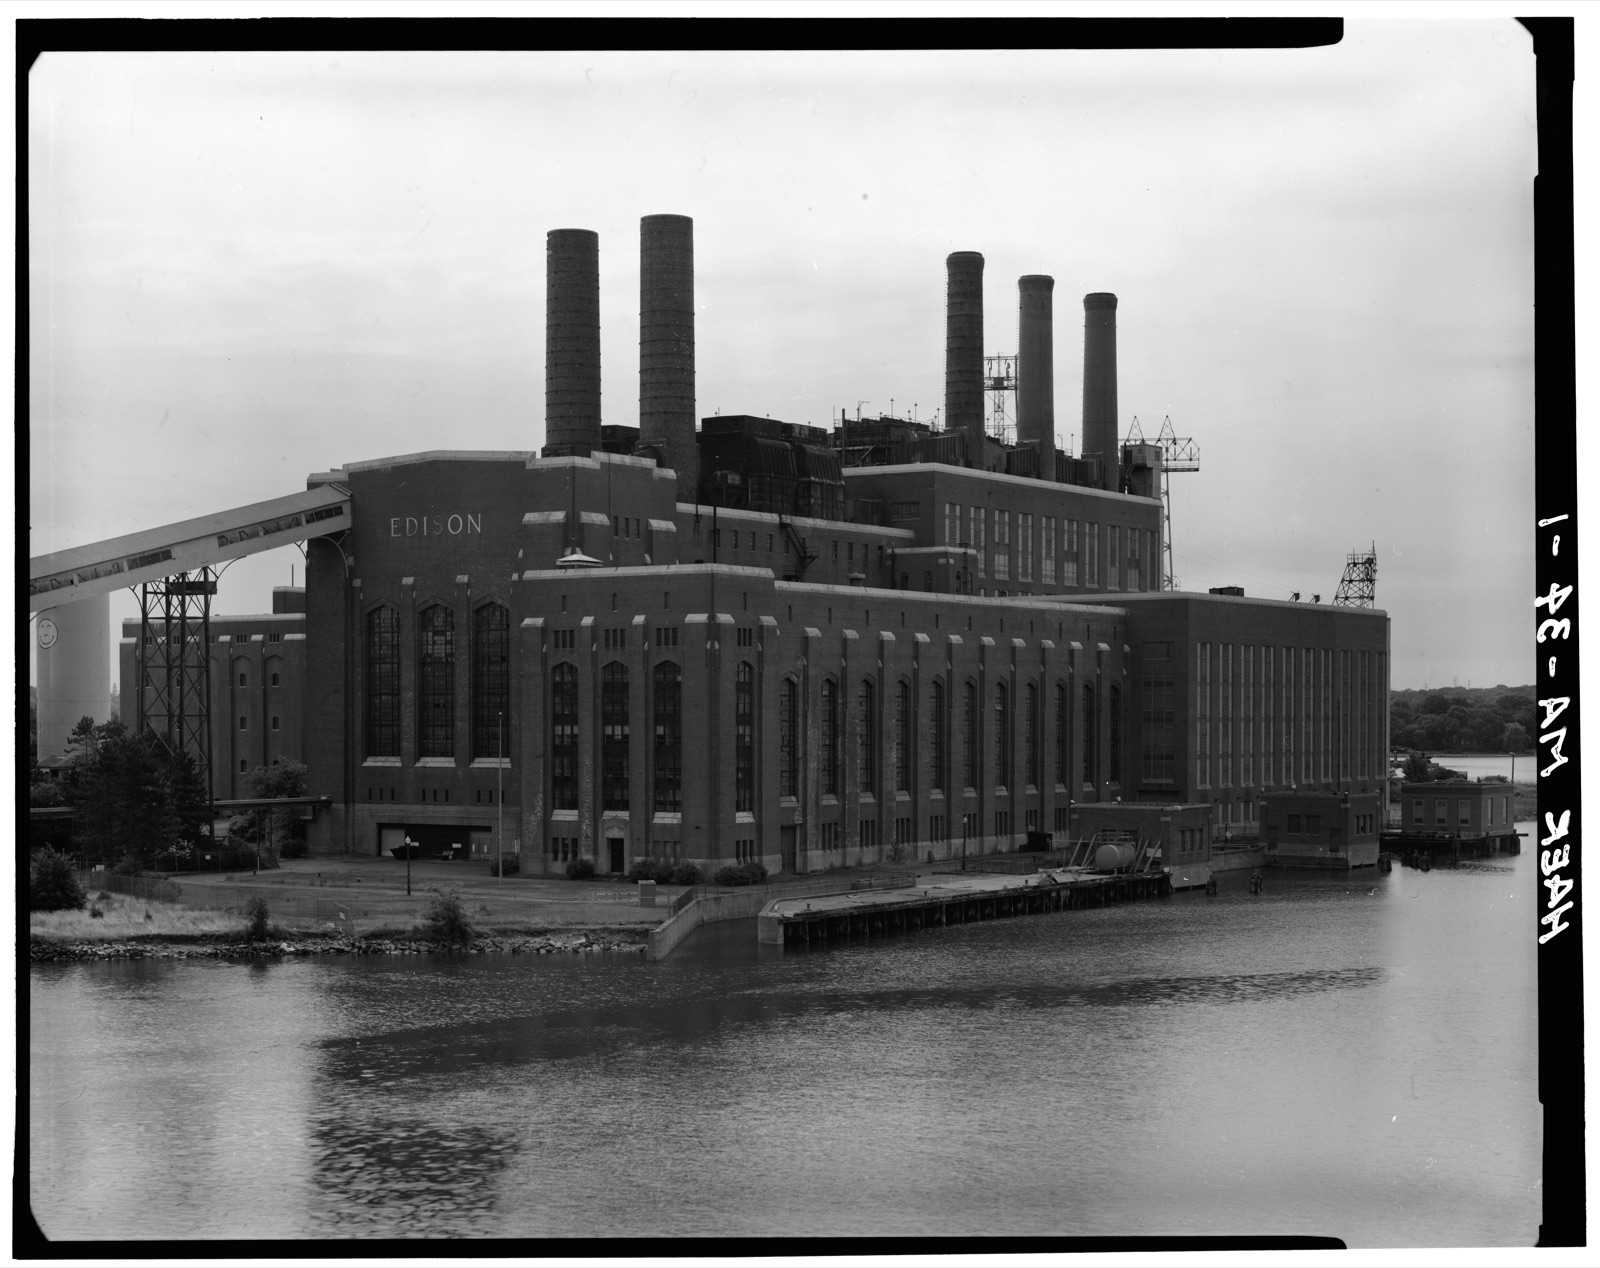
L Street Station, 1898. Built on filled flats by the Boston Electric Light Company, bought by Edison, and run for six decades.
Prologue · Sargent's Wharf
Sargent's Wharf, 1895: ferry slips and a coal shed. Next door, a cold-storage warehouse would soon build a power plant of its own.
Prologue · Lincoln Wharf
Lincoln Wharf, 1898. The atlas records the ground itself: dock, piles, solid fill. The power station that rose here in 1901 ran until 1972.
Chapter 1 · 1886 – 1900 · The first customer: lighting
The grid begins with lamps
On 20 February 1886 the Edison Electric Illuminating Company lit its first customer, the Bijou Theatre: 800 lamps from one engine. Demand came in the evening, when the lights went on.
The state counted the new system the only way it knew how. Until about 1910 the regulator reported electric companies in lamps, not kilowatts.
Decision1885 & 1887 — the state creates a board to license gas, then electric, companies+
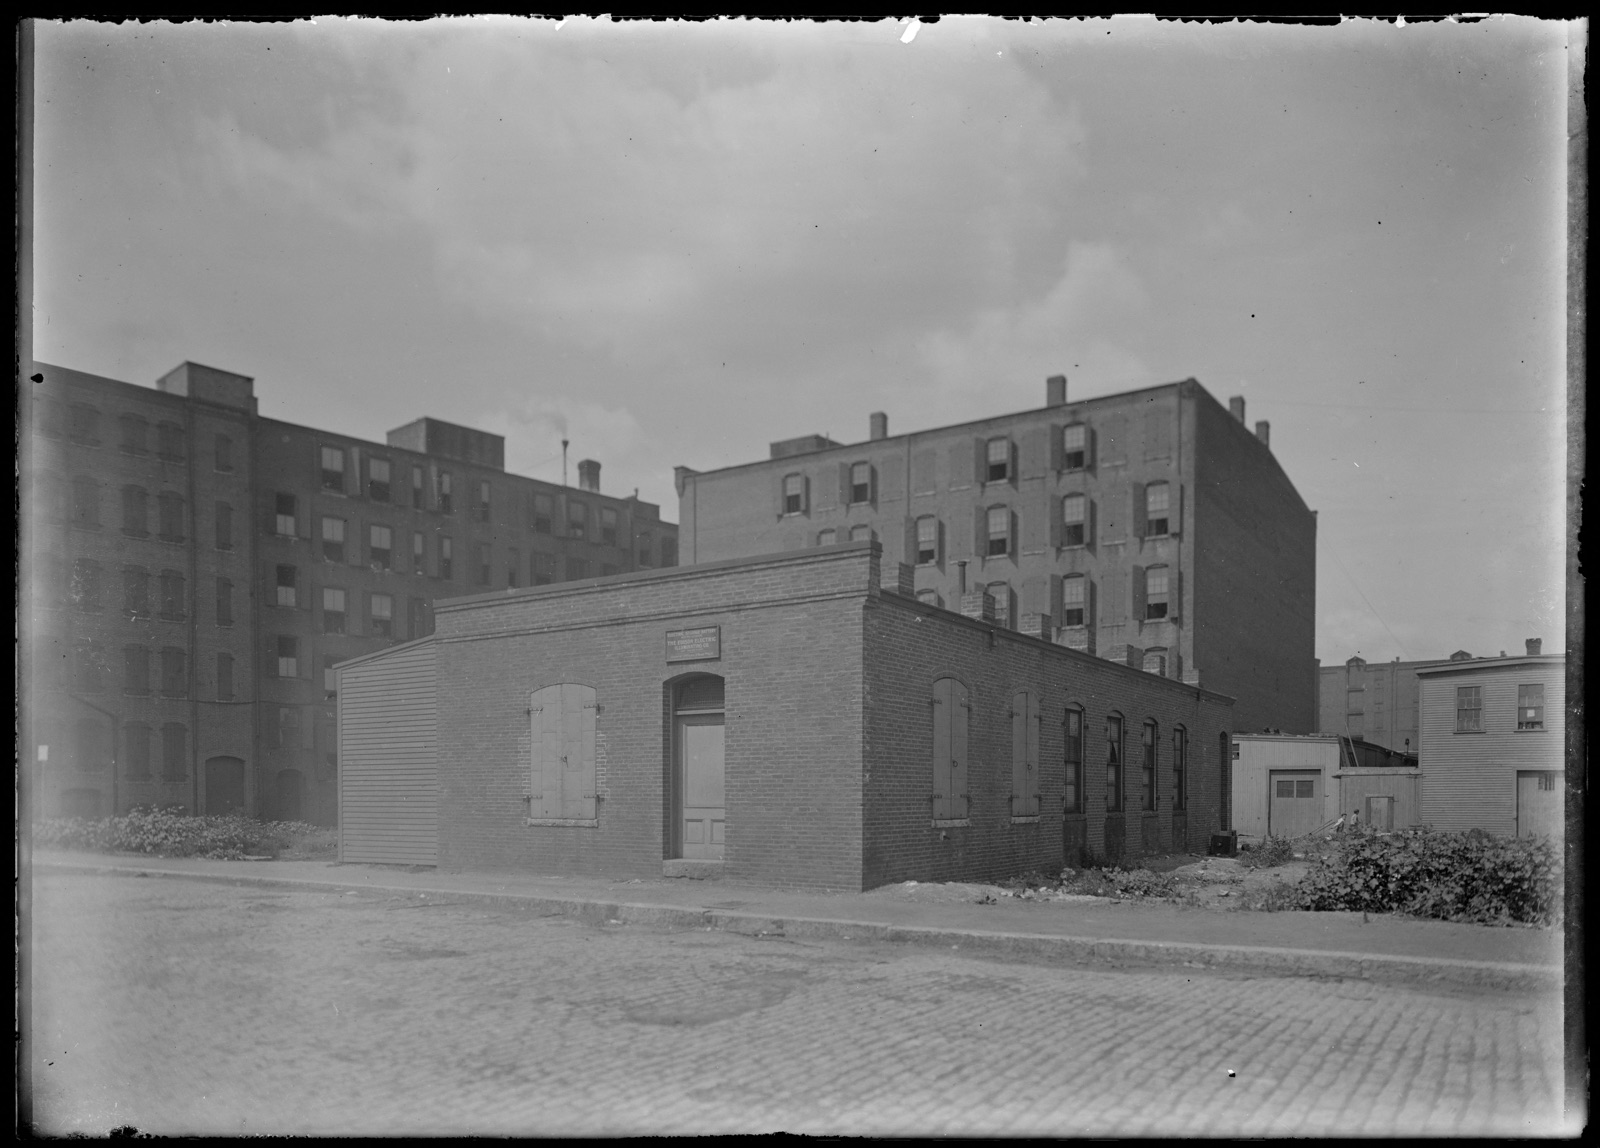
St. 1885 c. 314 created the Board of Gas Commissioners; St. 1887 c. 382 extended it to electric light and required a city's consent before a second company could string wires. Exclusive territory starts here.verified
Chapter 2 · 1889 – 1901 · The first big customer: streetcars
A customer big enough to build its own plant
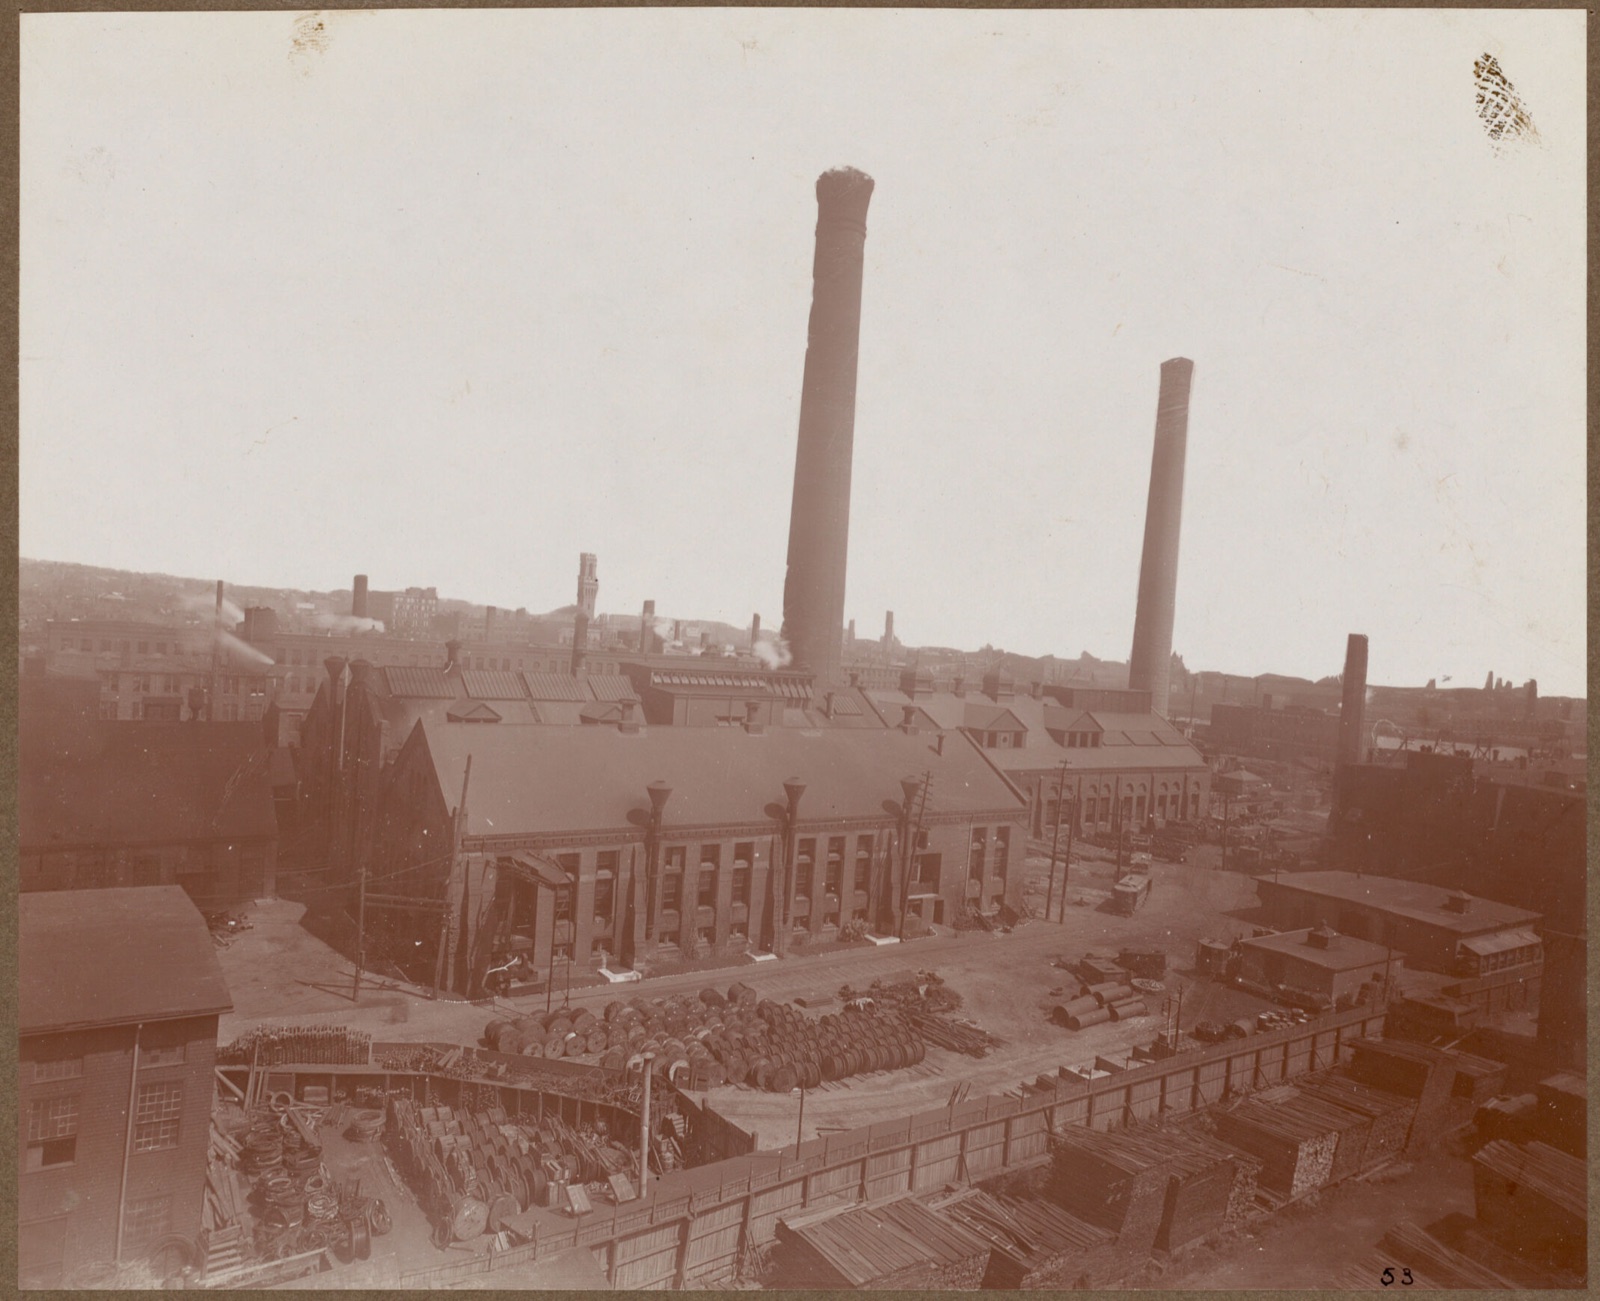
The streetcar system needed more power than any lighting company could sell it. So it built its own stations. This is the Central Power Station on Harrison Avenue, the largest in the city.
Look at the label on the 1902 atlas: Boston Elevated Railway Company (Lessee), printed over West End St. Railway Co. The biggest plant in Boston was rented.
Decision1894 / 1897 — the Boston Elevated Railway is chartered, and generates its own power+
The charter is St. 1894 c. 548, amended by St. 1897 c. 500. Whether either act granted the power to self-generate has not yet been confirmed from the text.unverified
Chapter 2 · Quincy Market Cold Storage, 1906
Boston was unusual. In 1910 its Edison company sold only 4.5% of its output to street railways. In Hyde Park the figure was 83%. Here, the traction company was its own utility.
Even a warehouse could do it. The Quincy Market Cold Storage company built a power house of its own at Sargent's Wharf. Remember this site.
Chapter 3 · 1910 – 1940 · Motors, then appliances
The grid learns to grow demand
Between 1910 and 1920, motors overtook lamps. The appliance era began on a grid that industry had already rebuilt around all-day load.
The rates were not written to reward size. They were written to reward buying a machine. A household that lit its rooms paid a flat 10½ cents a kilowatt-hour, and the schedule said plainly: no free wiring. The same household, having bought a range, a water heater or a refrigerator, dropped to 2 cents on everything above ten kilowatt-hours a month — a fifth of the price, on one condition, which was not how much it used but what it used the electricity for.
This is the thing worth holding on to. A volume discount rewards consumption you already have. An end-use rate manufactures consumption you do not: it pays for itself only once you own the appliance, so the appliance is what the price is really selling.
Decision1921 — a rate you qualify for by owning an appliance+
Edison Electric Illuminating Co. of Boston, prices as filed on 30 June 1921 and reprinted by the Department of Public Utilities. Lighting: “for electricity for any use, 10 cents net a k.w.h. plus 5%” — flat, with a $9 minimum and “no free wiring”. Then the carve-out: “When energy is used only for cooking, heating and refrigeration … a rate of 2 cents a k.w.h. on all in excess of 10 k.w.h. a month.” Declining blocks did exist — 5¢, 3¢, 2½¢ — but only inside an optional yearly demand contract, and under “miscellaneous energy” at volumes no household of 1921 reached.verified
This corrects an earlier version of this page, which called the household tariff declining-block. It was not. The correction makes the argument sharper: the price did not reward using more, it rewarded buying the machine.
DPU Annual Report for the year ended 30 Nov 1921, Part II §1, pp. 47–49 →
And the Commonwealth had already built the bookkeeping for it. The Department’s own Uniform System of Accounts, prescribed in 1922, requires every electric company to keep an account for canvassers, solicitors and demonstrators, one for “newspaper advertisements, booklets, posters, dodgers”, and one — E665, “Wiring and Appliances” — for the cost of wiring customers’ homes and appliances “furnished without charge to the consumer for the purpose of securing new business.” There are matching accounts for selling appliances and for renting them out.
Massachusetts wrote the ledger lines for demand creation before it ever had to rule on it. Load-building was not a deviation from the regulated utility here. It was a chart-of-accounts category.
Absence1923–1960 — the prices stop being printed+
The 1921 volume is the last to reprint what each company charged. The 1922 volume drops the “Prices” section; the bound 1926–1940 run carries no rate structure at all. The returns kept being filed — the Commission on Administration and Finance declined to authorise printing them. The silence in this chapter is a budget decision, not a lost archive, which is why the next four decades of this story are told with national data and photographs rather than Boston prices.verified
Chapter 4 · 1950s – 1990s · Air conditioning
The day the grid is sized for moves to July
For most of the twentieth century, New England's biggest hour of demand came on a winter evening. Around 1990, a July afternoon overtook it — and stayed ahead.
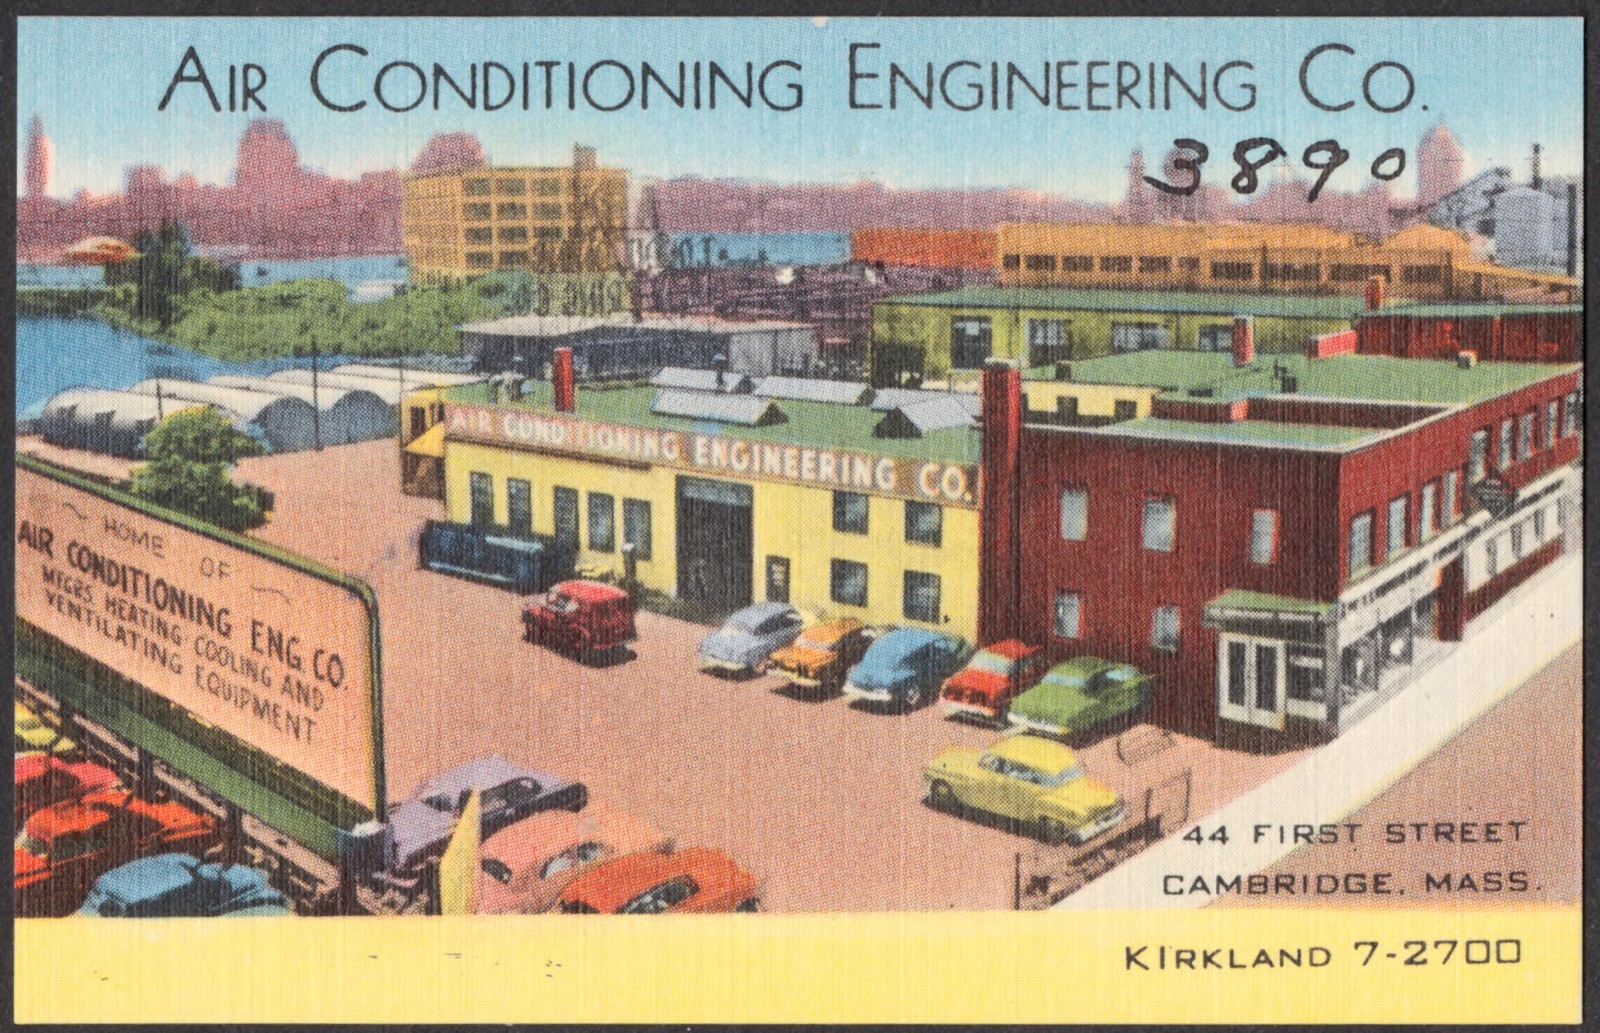
The chart shows every year we could verify. The crossing was narrow: in 1993 the two seasons were 36 megawatts apart, two tenths of one percent. Boston got there earlier. By 1986 the city's summer peak was already 12% above its winter peak.
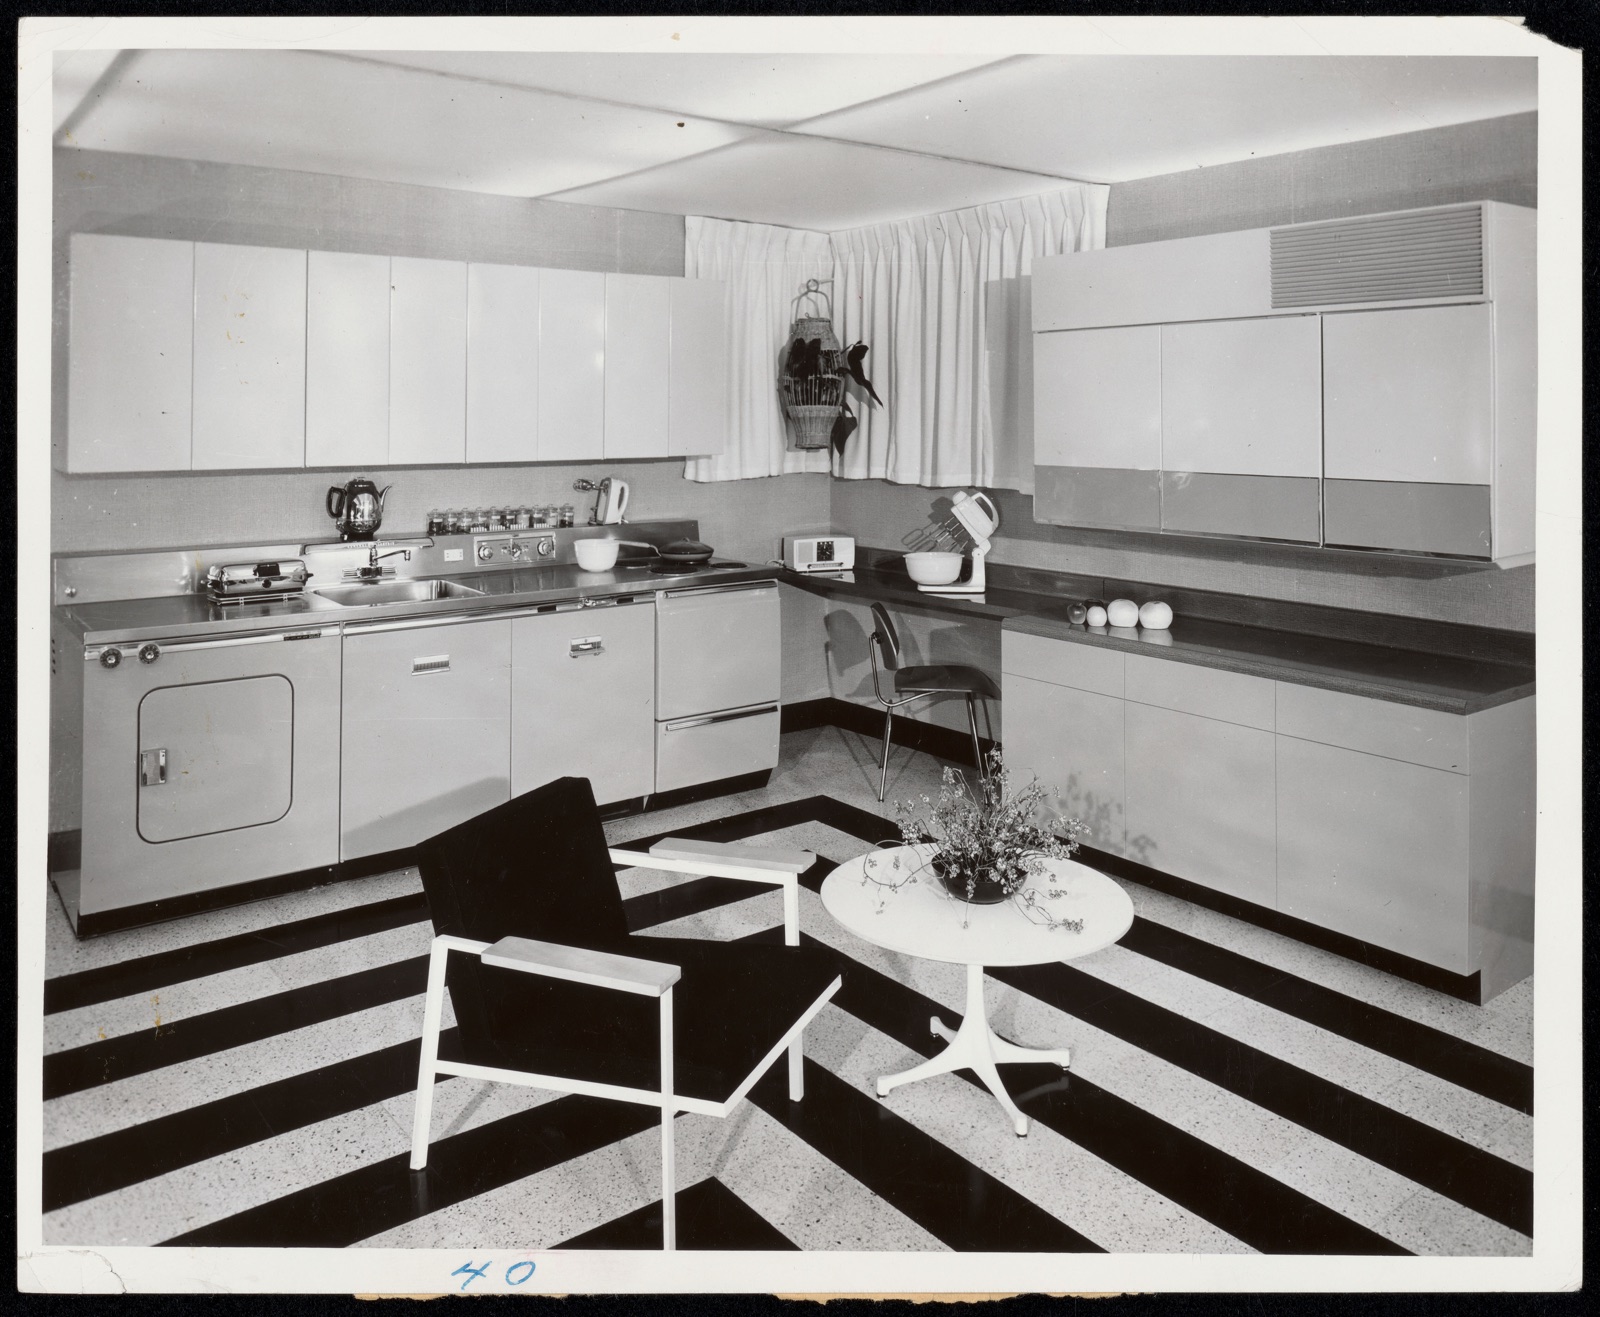
It arrived unevenly, and the unevenness is the point. In 1960 6.2% of homes in Boston’s suburban ring had air conditioning against 3.9% in the city. By 1980 the metropolitan figure was 42.7% and the city’s 30.5%. The ring was ahead at every census — and the ring is where the wires had the most room. Massachusetts also never ducted itself: central air reached 0.5% of homes in 1960 and 5.1% by 1980, so the cooling load arrived as window units, plugged in one at a time, on circuits nobody re-sized to receive them. Each pair compares places in the same census; the 1960 figures count occupied units and the 1980 figures year-round units, so read the ring-against-city gap rather than the climb between them.
Decision1985 — Boston Edison forecasts a switch back to winter peaking by 1995. It never came.+
The Energy Facilities Siting Council's 1987 decision on Boston Edison's long-range forecast records the company as "a summer peaking system" (1986: summer 2,519 MW, winter 2,246 MW) and notes its 1985 forecast of a switchover to winter by 1995. The region has been predicting its own return to winter peaking, and mis-dating it, for forty years.verified
Chapter 5 · 1960s – 2014 · Gas heat
The second network under the street
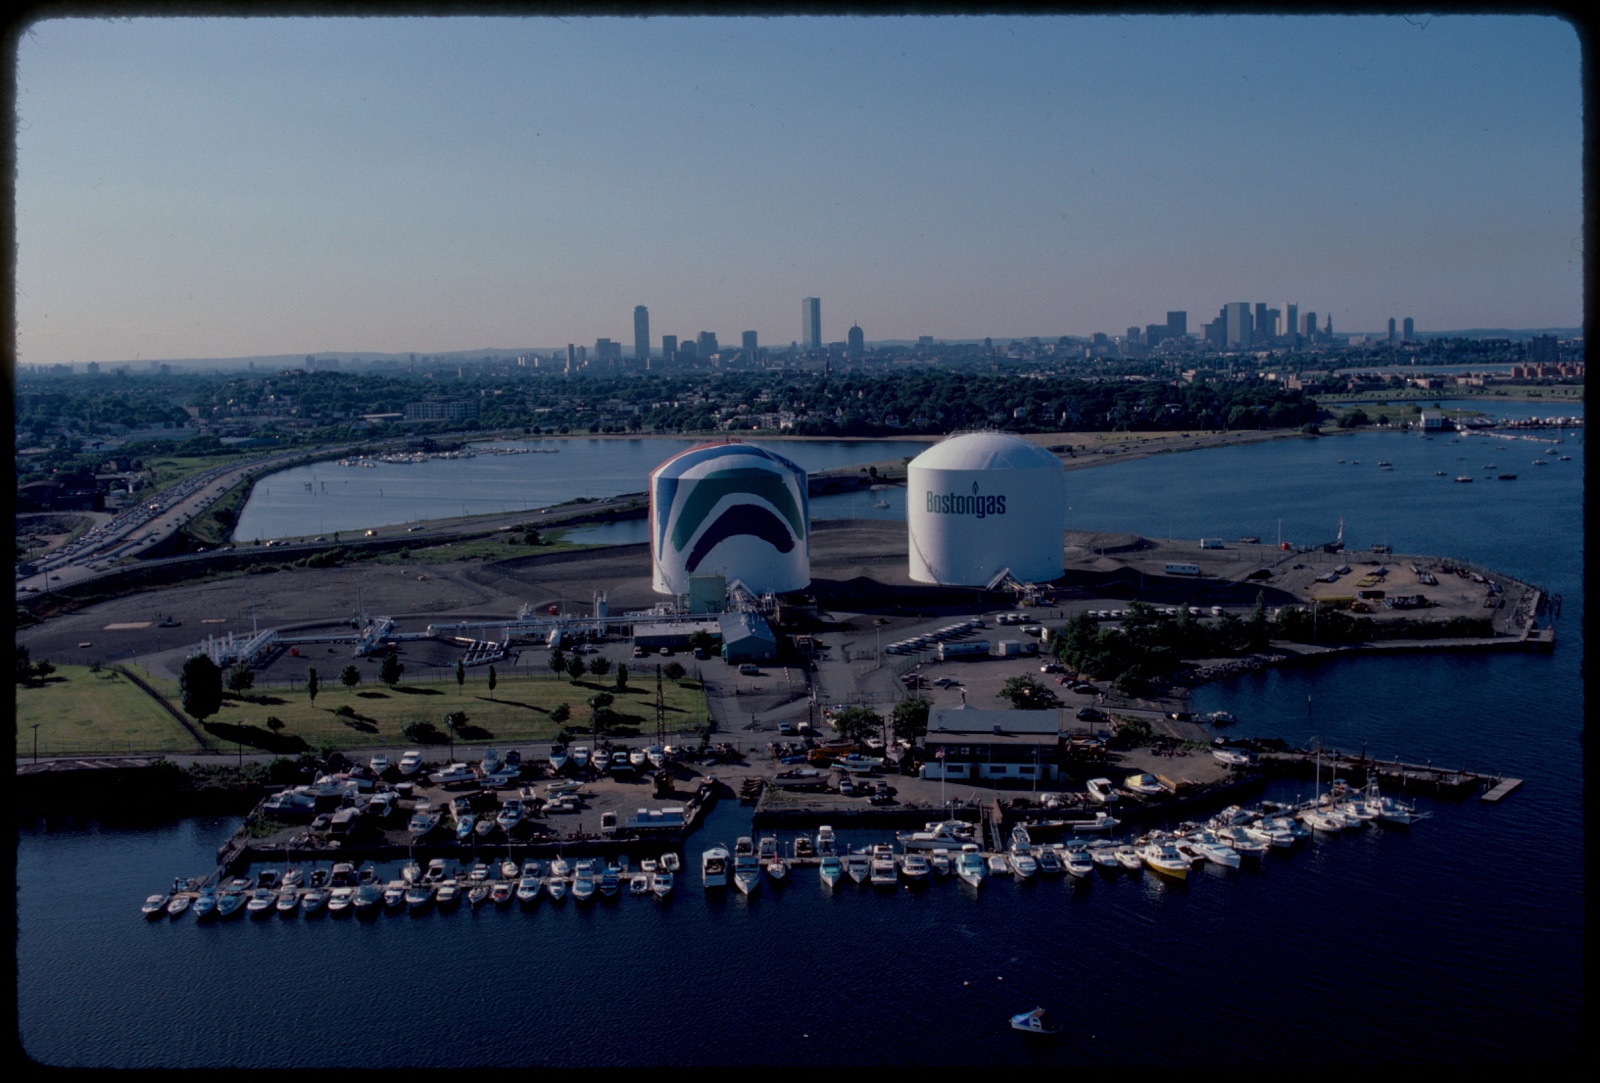
Heating went to gas. Under Boston runs a second grid: 1,513 miles of cast-iron main and 580 miles of bare steel — more leak-prone pipe than every other Massachusetts gas company combined.
The map shows reported gas leaks per square kilometer by census tract. Switch to see where pipe is being replaced.
Decision2014 — Chapter 149 creates the Gas System Enhancement Plan: replace the pipe, bill every customer+
St. 2014 c. 149 added G.L. c. 164 §145, letting gas companies recover the cost of replacing leak-prone pipe from all ratepayers through an annual plan. In 2024 the section was rewritten so the same money can retire pipe and build networked geothermal instead.verified
The wires today · 1 of 3
How electricity reaches Boston
No power plant remains inside the city. Electricity arrives on high-voltage transmission lines — … of them at 345,000 volts, … at 115,000 — and steps down at … substations across Suffolk and Middlesex counties.
Thick lines are 345 kV, thin lines 115 kV. Dots are substations. Hover either.
The wires today · 2 of 3
The neighborhood wires
From each substation, feeders run beneath and along the streets at 13,800 volts — … circuits on this map — or on the older 4,000-volt network that still serves parts of the city, … circuits. A transformer on a pole or a pad drops each feeder to the 120 and 240 volts at your meter.
Everything in the rest of this story — the data center, the charger, the solar roof, the heat pump — plugs into one of these lines.
This is Eversource's own map of its distribution feeders. Hover any line for its circuit number, substation and voltage.
Decision1887 — one company per city: the consent rule that made the wires a monopoly+
St. 1887 c. 382 §3 required a city's consent before a second company could string wires in its streets. Exclusive territory begins here; today Eversource is Boston's only electric distributor.verified
The wires today · 3 of 3
The one number the utility publishes about each line
For every feeder, Eversource publishes how much new solar it could accept — its hosting capacity. … of … feeders have room for a megawatt or more; … have less than a tenth of that.
It publishes nothing about how much new load — chargers, heat pumps, computers — each feeder can take. That is the number the rest of this story keeps asking for.
Switch between voltage, room for solar, and the feeders that serve the downtown secondary network — the densest part of the grid, where the data centers sit. Then press Room for load. Same lines, same map, and the fourth one is blank: that figure is published for none of the … circuits.
Chapter 6 · 1997 – 2010s · Data centers, first wave
Generation leaves the city. A flat load arrives.
In 1998 Boston Edison sold its power plants — 1,987 megawatts, Mystic and New Boston among them. Since then the big Boston-area plants have closed one by one. The last of Mystic shut in 2024.
The new customer ran flat, all day, every day. Massachusetts has … listed colocation buildings; … of them sit inside this map, and two are carrier hotels shared by more than one operator — 1 Summer Street, where Markley and DataBank both sit, and 70 Inner Belt Road in Somerville, shared by CoreSite and FirstLight.
They did not scatter. … of the facilities on this map draw from feeders supplied by one substation: Mystic — which carries the name of the generating station that closed in 2024. The plant left; its substation stayed; the new load plugged into it.
Blue lines are the feeders that serve the downtown network. Gold rings mark buildings with more than one operator. Hover a data center for its operators, feeder and supply substation.
Decision1997 — restructuring: the utility sells its plants; large customers may buy power directly+
St. 1997 c. 164 (25 Nov 1997) opened retail choice and required divestiture. D.T.E. 97-113 (24 Apr 1998) approved the sale of Boston Edison's fossil fleet: Mystic 990 MW, New Boston 778 MW, Edgar, Framingham, West Medway, Wyman 4.verified
The data centres · 1 of 2 · Who they are
Twenty-seven facilities, twenty-five buildings
Massachusetts has … listed colocation buildings in the Boston market, holding … separately operated facilities. … of the buildings are inside this map. They are not hyperscale campuses; they are floors and suites inside older commercial buildings, run by carriers and colocation landlords.
The map is 2023 aerial photography. Click any dot — or any building below — to fly in over its roof and read its operators, size, tier, certifications and feeder.
The data centres · 2 of 2 · What they will not tell you
The load is the one number nobody publishes
Of the … buildings, … publish how much power they draw. Inside this map, exactly … does.
… publish a floor area, and most advertise their tier rating, their fibre carriers and their audit certifications in detail. Electricity — the thing that decides whether the feeder outside can carry them — is absent.
The four facilities in eastern Massachusetts that do publish a figure add up to … megawatts, and every one of them is outside Boston: Needham, Bedford, Northborough, Medford. (A fifth, the university consortium in Holyoke, publishes 10 MW and is across the state.) The downtown carrier hotel that anchors New England's fibre publishes its tenant count and its carrier count, and no megawatts at all.
Why it mattersA load nobody has to declare cannot be planned for+
Eversource publishes, per feeder, how much new generation it can accept. It publishes nothing about new load. Data centres publish floor area and certifications, not megawatts. Neither side of the connection is obliged to state the number that matters, so the public record cannot answer the simplest question about this map: if another one opens on that street, does the wire hold?verified
The one route to a real figure is the backup generators: diesel plant needs an air permit from MassDEP, and permits are public per site. That is the next thing to pull.lead
Chapter 7 · 2010s · Solar
Loads that run backward
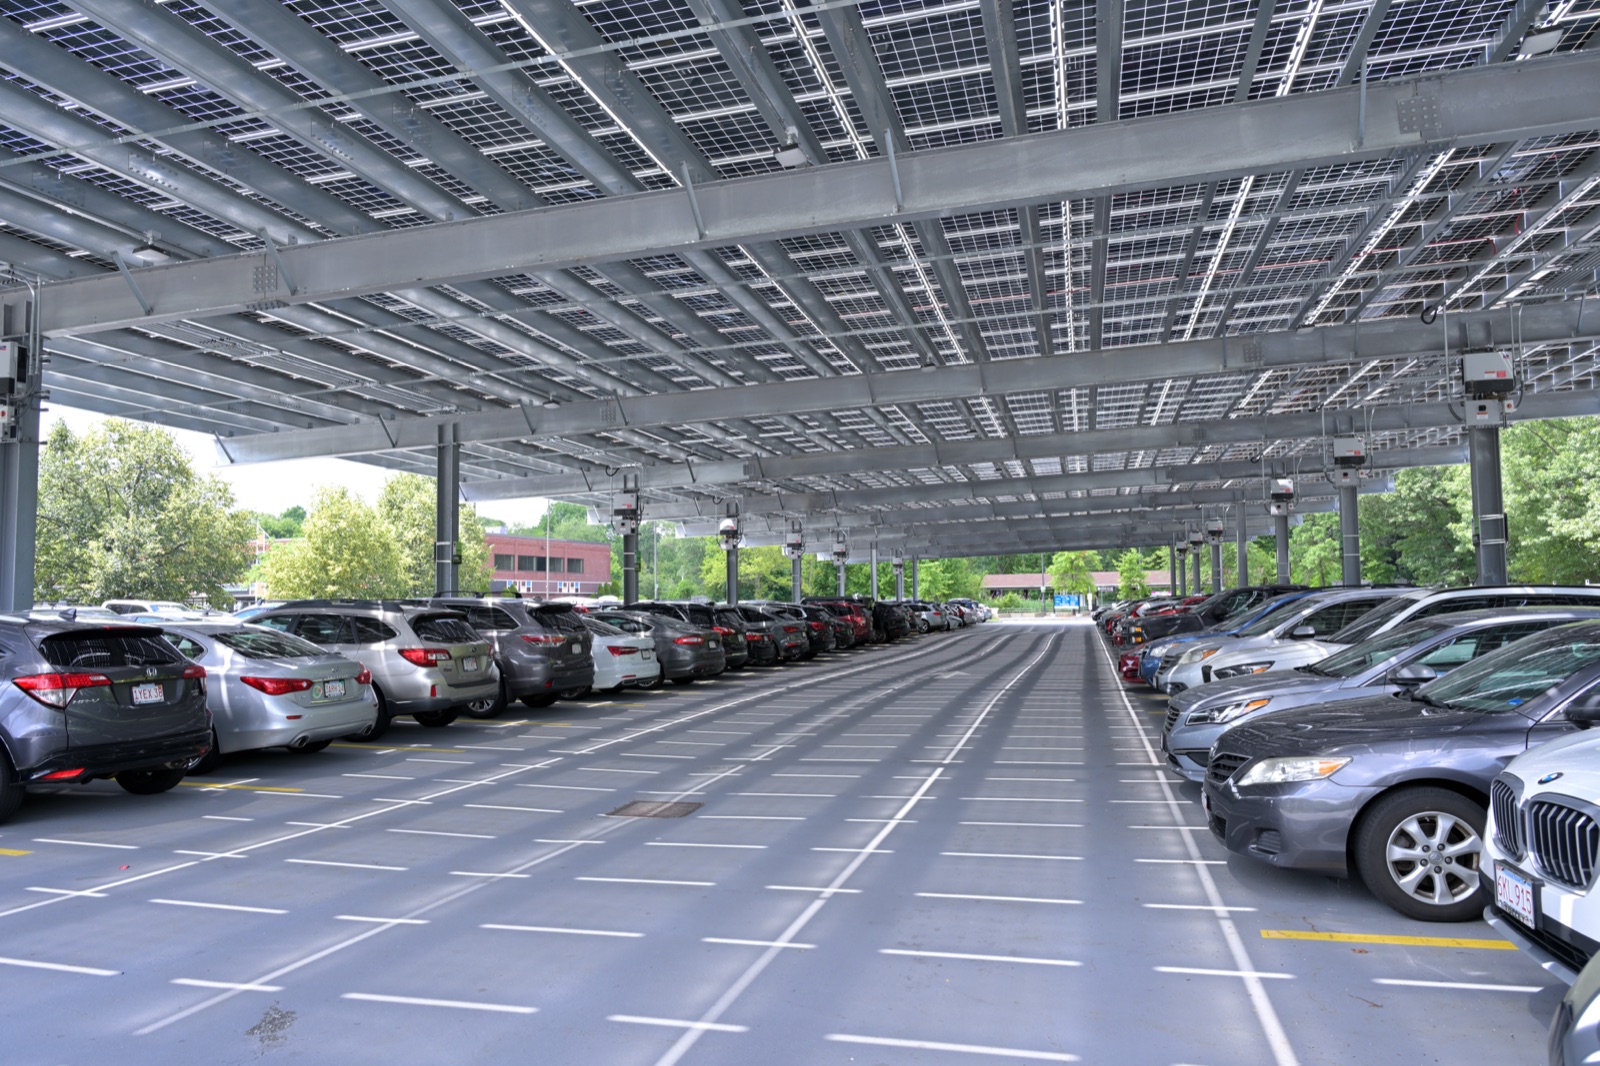
Now the customer's equipment feeds the grid, or is paid to hold back. Boston has 4,466 solar installations, and a household battery enrolled in ConnectedSolutions is paid $275 per kilowatt each summer to discharge when the grid asks.
Massachusetts records every installation by ZIP code, not by address. The largest concentration is ZIP …, with … systems.
Each circle is a ZIP code, sized by its number of installations. Hover for the split between houses, multifamily buildings and commercial roofs.
Chapter 7 · 2010s – 2020s · EV charging
Chargers arrive on the curb
By April 2023 Boston had … public charging stations with … Level-2 and … fast ports — … of them opened in 2021 alone. The city's own program adds … sites: … ports installed, … planned, … of the sites at the curb, and … curbside segments scored for the next round.
Blue dots are public chargers, sized by ports. Dark dots are the city's own sites. The tint is a ten-minute walk from an existing charger. Toggle the scored candidate segments.
Decision2022 & 2025 — ratepayers fund the charger's wiring; the host keeps the charger. Batteries are paid by the kilowatt.+
D.P.U. 21-90 (30 Dec 2022) approved $188 million of Eversource EV make-ready over four years — the utility pays the wiring up to the charger, recovered from all customers at 15 to 21 cents a month. D.P.U. 24-149 (28 Feb 2025) continued ConnectedSolutions; residential batteries under 50 kW earn $275/kW of average summer performance.verified
Chapter 7 · The connection
Every charger plugs into a feeder
Each dot is a charger, coloured by the feeder it sits on. … of the … public chargers are on feeders that also serve the downtown network; the rest spread across the territories of … substations. … sit on feeders with almost no published room for solar — which says nothing about room for a charger, because that number is not published.
| Supply substation | Feeders | Chargers | Ports |
|---|
Each charger is matched to its nearest feeder from the map geometry — our computation, not the utility's. Hover a charger for its feeder and substation.
Chapter 8 · 2020s · Heat pumps
Heat moves onto the wires
Heat pumps put winter heating on the electric grid. ISO New England expects the winter peak to overtake summer again around 2036.
The transformers sized for July in chapter 4 will be the wrong size. Massachusetts publishes no map of where the wires have room for new load; the utility's public map shows where solar can connect, not where heat can.
Behind the chart, the feeders are coloured by their published room for solar. Toggle the forecast between ISO New England's central and high cases.
Decision2023 — the gas utilities must plan to electrify. The wires plan to match is still being written.+
D.P.U. 20-80-B (6 Dec 2023) required gas companies to file decarbonization plans and, by 1 March 2026, proposals to retire pipe by targeted electrification.verified
Chapter 9 · 2026 · Compute, now
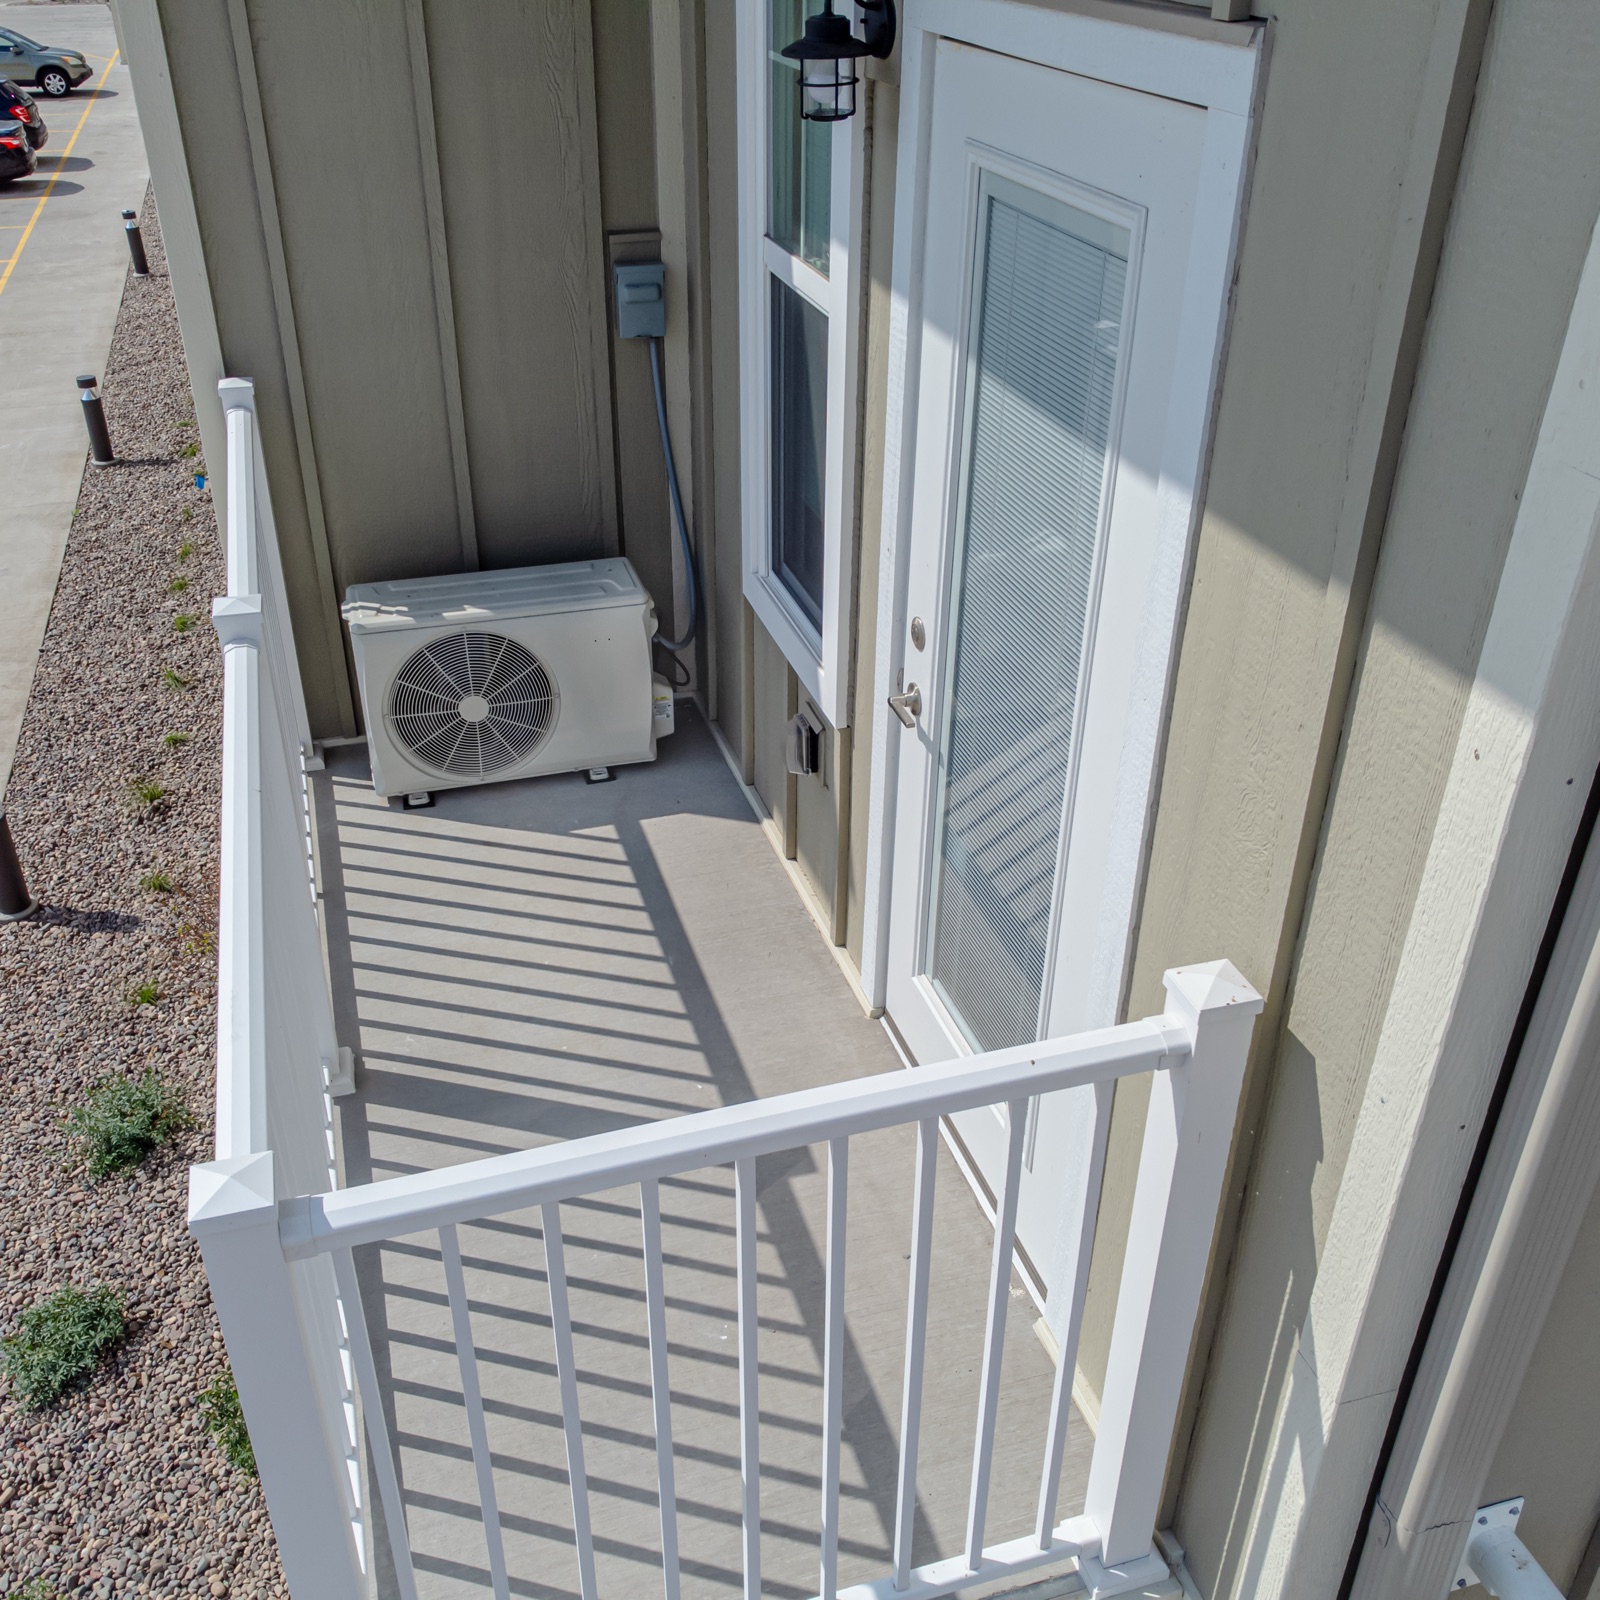
The next customer is small, and it's on your wall
The data-center boom is going around New England. ISO New England's 2026 forecast counts about 110 megawatts of large new loads across all six states in the 2030s — and only one data center, a 200-megawatt project in the Boston zone, which it discounts by 70% as "speculative."
What comes instead is small: compute in homes, on the feeders with room. The first such home was connected in 2026. Nobody publishes how much power one node draws.
The map shows household energy burden — the share of income spent on energy — by census tract. The ghost marker is the 1906 cold-storage power house from chapter 2: a private load big enough to want its own plant.
Decision2026 — the lease, the tariff, the allocation rule. Not yet written.+
Who pays when a new load needs a bigger transformer? Eversource's Terms and Conditions (M.D.P.U. No. 3D) set a cost-sharing rule for single-family homes. For a large customer there is no written rule at all; the company decides "in the exercise of reasonable judgment."verified
Terms and Conditions for Distribution Service → · ISO-NE 2026 large load forecast →
Closing
The grid has always been rebuilt around its biggest customer. The bill has always landed on everyone else. The next customer is being chosen now.
Where to look
Every site in this story at once: the power plants and gas works of 1828–1930, today's substations, and the data centers. Hover a dot for its name.
- 1When a rate case is filed, ask which customer it is built for.
- 2Before you host a charger, a battery, or a compute box, ask who pays if the transformer has to grow.
- 3The dockets are public. DPU File Room →